• Statistics (Time Series Analysis, Generalized Linear Models, Bayesian Statistics, Stochastic Processes/ Markov Chains, Spatial Statistics)
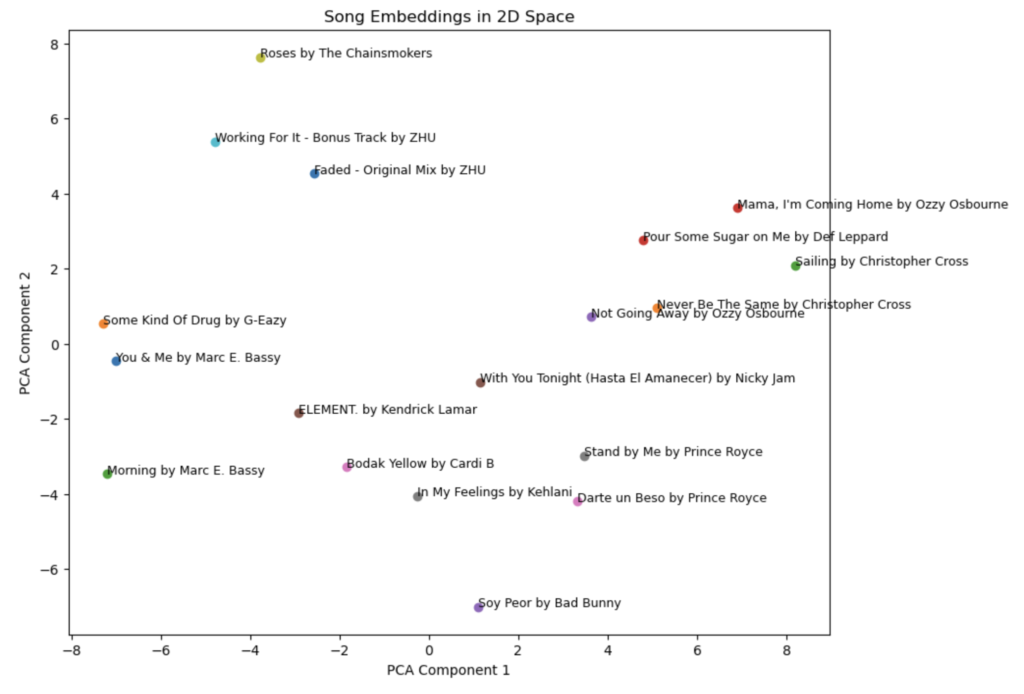
• Art (Photography, Sketching, Graphs, Dancing, Electronic Music, Skateboarding)
• Working Collaboratively, Economics, Politics, History, Social Issues, Teaching, Brainstorming, Process Mapping, Meeting New People, Learning New Things, Presenting